
The gateway works on your laptop, and now someone wants it in production, which means someone (probably you) gets paged when it misbehaves at 3am. Before that page fires you want to know what the process exposes: which numbers move when an upstream dies, where the log line for a failed request lands, and what the gateway does on its own while you are still finding your glasses. SBproxy's pitch is "Take control of your AI traffic.", and the operational half of that promise is that the same Apache-2.0 binary that routes to 72 providers or serves weights on your own GPUs also ships the metrics endpoint, the structured access log, the health probes, and the self-healing behavior this page walks through. Everything an on-call shift needs was already in the process you deployed; this page is about learning where it all is before the pager teaches you.
What you will build
A three-origin config that stages a small incident on your desk. app.local is a healthy service. checkout.local proxies to a dead local port, so every request to it fails the way requests fail when a backend host dies. payments.local points at the same dead port but declares a fallback origin, so its callers get a degraded 200 instead of an error page. Around those three origins you turn on the production surface: the always-on Prometheus endpoint, the JSON access log with forced emission for errors and slow requests, and the admin server with its health probes and live request log. A Docker Compose file then adds Prometheus and Grafana, pre-provisioned with the dashboards and alert rules that ship in the repo's dashboards/ directory, and the page closes with what the first real incident looks like: which alert fires, what the runbook says to check, and how to roll back.
Prerequisites
curlfor sending requests.jqhelps but nothing here requires it.- Docker with Compose v2.23 or newer for the Prometheus and Grafana stack. The proxy config itself runs standalone with no external dependencies, so you can do everything except the dashboards without Docker.
- No provider API keys. The example never calls an upstream that exists.
Install
Pick the option that fits your platform:
# Linux / macOS, single static binary:
curl -fsSL https://download.sbproxy.dev | sh

# macOS via Homebrew:
brew install soapbucket/tap/sbproxy

# Docker / Kubernetes:
docker pull soapbucket/sbproxy:latest
The manual covers the rest of the install matrix, checksums, and air-gapped installs.
Minimal config
Save this as sb.yml, or use the copy in examples/use-case-production-ops/. Every key appears in the Config Reference or a shipped example. Three blocks matter, so here they are one at a time.
First, the admin server. This is the control plane: it answers the unauthenticated health probes your orchestrator needs (/livez, /readyz, /health), keeps an in-memory ring buffer of recent requests you can query during an incident, and serves a second copy of /metrics. It lives on its own port so you can firewall it separately from customer traffic. By default it binds loopback only; the config widens it to private ranges so the Compose network can reach it, which is as far as you should widen it without TLS (see admin.md in the repo docs).
proxy:
  http_bind_port: 8080

  admin:
    enabled: true
    port: 9091
    bind: 0.0.0.0
    allow_ips: ["127.0.0.0/8", "10.0.0.0/8", "172.16.0.0/12", "192.168.0.0/16"]
    username: admin
    password: change-this   # demo value; rotate before real use
    max_log_entries: 1000
Second, the access log. It is off by default, and production wants it on: one JSON line per completed request, emitted on stdout for whatever log shipper you already run. The two forced-emission knobs are the part worth internalizing. At high traffic you will eventually sample (sample_rate: 0.05 is common), and sampling is exactly how you lose the one line you need at 3am. always_log_errors and slow_request_threshold_ms bypass the sampler, so every 5xx and every slow request lands no matter what the dice said.
access_log:
  enabled: true
  sample_rate: 1.0
  always_log_errors: true
  slow_request_threshold_ms: 1000
  capture_headers:
    request: ["user-agent", "x-request-id"]
Third, the origins. The healthy one is a static action so the example needs no network; in production it is type: proxy with your upstream URL (the examples use https://test.sbproxy.dev as the placeholder). The two failing origins point at port 9, the discard port, where connects are refused instantly. checkout.local has a retry block, which soaks transient blips but cannot save a dead host, so its callers get a 502. payments.local declares a fallback_origin that answers on transport errors and on 502/503/504, so its callers never see the failure, only a degraded body and an X-Fallback-Trigger debug header.
origins:
  "app.local":
    action:
      type: static
      status: 200
      content_type: application/json
      json_body: { service: app, status: ok }

  "checkout.local":
    action:
      type: proxy
      url: http://127.0.0.1:9
      retry:
        max_attempts: 2
        retry_on: [connect_error, timeout, 502, 503]
        backoff_ms: 50

  "payments.local":
    action:
      type: proxy
      url: http://127.0.0.1:9
    fallback_origin:
      on_error: true
      on_status: [502, 503, 504]
      add_debug_header: true
      origin:
        id: payments-degraded
        hostname: payments-degraded
        workspace_id: examples
        version: "1.0.0"
        action:
          type: static
          status: 200
          content_type: application/json
          json_body:
            status: degraded
            message: "payments upstream temporarily unavailable, serving degraded response"
            retry_after_secs: 30
Notice what is missing: a metrics block. The Prometheus endpoint is always on, served at /metrics on the data-plane port. Scrapes are rate-limited to one per second, so a second scrape inside the same second gets an empty body; a 15s scrape interval never notices.
Run it
Start the proxy:
sbproxy serve -f sb.ymlSend traffic, then read the evidence
Three requests, three outcomes:
$ curl -s -H 'Host: app.local' http://127.0.0.1:8080/
{"service":"app","status":"ok"}

$ curl -si -H 'Host: checkout.local' http://127.0.0.1:8080/ | head -n 1
HTTP/1.1 502 Bad Gateway

$ curl -s -H 'Host: payments.local' http://127.0.0.1:8080/
{"message":"payments upstream temporarily unavailable, serving degraded response","retry_after_secs":30,"status":"degraded"}
The 502 is already a counter before you open anything:
$ curl -s http://127.0.0.1:8080/metrics | grep 'sbproxy_requests_total{'
sbproxy_requests_total{agent_class="unknown",agent_id="human",agent_vendor="unknown",content_shape="",hostname="app.local",method="GET",payment_rail="",status="200"} 1
sbproxy_requests_total{agent_class="unknown",agent_id="human",agent_vendor="unknown",content_shape="",hostname="checkout.local",method="GET",payment_rail="",status="502"} 1
sbproxy_requests_total{agent_class="unknown",agent_id="human",agent_vendor="unknown",content_shape="",hostname="payments.local",method="GET",payment_rail="",status="200"} 1
Note the shape of the payments line: the client saw a 200, so the metric says 200. Degraded-but-served traffic looks healthy in the status counters, which is the point of the fallback and also the reason the access log matters. Each of those requests left one JSON line on stdout (trimmed here):
{"timestamp":"2026-07-06T14:03:21.070806+00:00","request_id":"019f3adcbaa67db1819e4f952ea34556","origin":"checkout.local","method":"GET","path":"/","protocol":"HTTP/1.1","host":"checkout.local","user_agent":"curl/8.6.0","status":502,"latency_ms":0.15,"client_ip":"127.0.0.1","trace_id":"f0882ea2213a4de88ea67d17b1784cbe","fallback_triggered":false,"retry_count":0,"error_class":"upstream_5xx","request_headers":{"user-agent":"curl/8.6.0"}}Three things to read off that line. status: 502 got here through always_log_errors, so it survives any sampling rate. error_class: "upstream_5xx" classifies the failure without you parsing anything. And there is no upstream_ttfb_ms field: the request never got a first byte from the upstream, which tells you the failure was at connect time, not a slow backend. The matching payments line carries "fallback_triggered": true, which is how you find the degraded-but-served traffic the status counters hide. On healthy proxied requests the phase fields (auth_ms, upstream_ttfb_ms, response_filter_ms) split latency_ms into who spent it, and the same observations feed the sbproxy_phase_duration_seconds histogram so the aggregate view does not require log scraping. The full field schema is in Request Logging.
The probes your orchestrator needs
The admin port answers the standard probe set, unauthenticated:
$ curl -s http://127.0.0.1:9091/readyz
{"status":"ok","components":[{"name":"agent_registry","status":"healthy"},...]}

$ curl -s http://127.0.0.1:9091/health
{"status":"ok","version":"1.2.0","build_hash":"5e8cfa8","uptime_seconds":312,"checks":[...]}
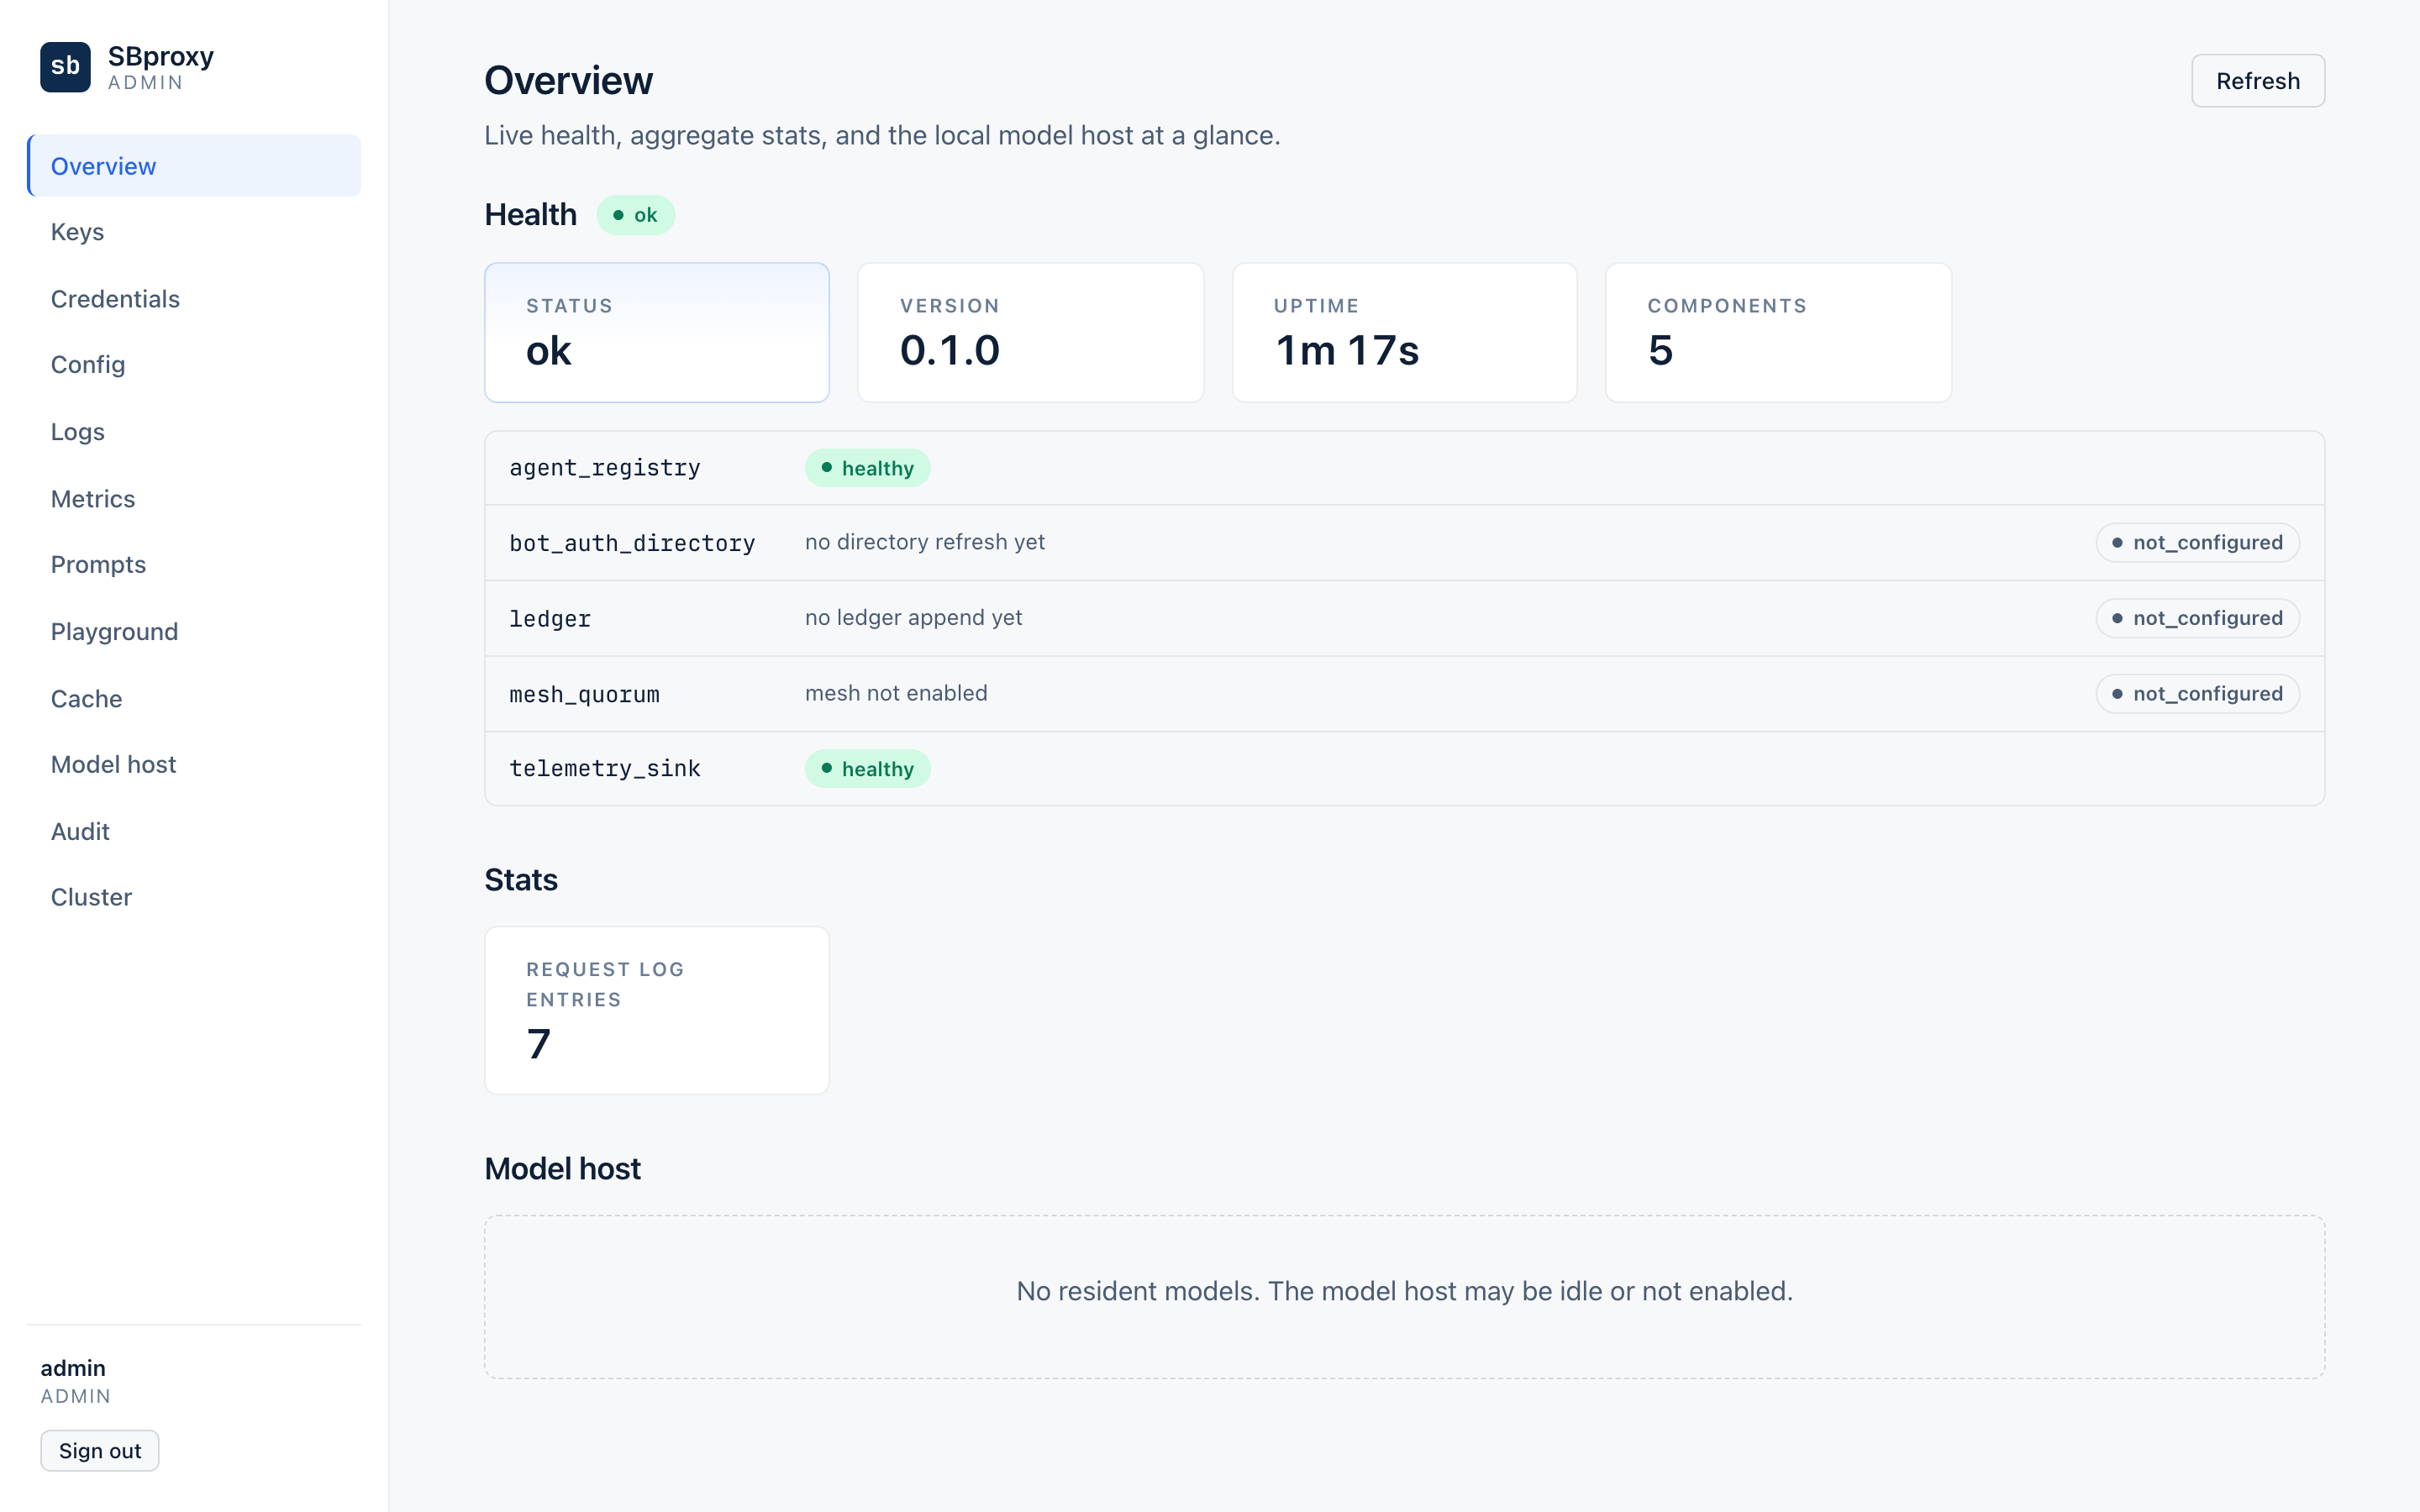
Point Kubernetes readiness at /readyz and liveness at /livez. /health is the rich one, for humans and SIEMs: version, build hash, uptime, and per-component checks, returning 503 with the failing component named when something required is down. The admin UI renders the same data as a health view:
Watching live traffic during an incident
The admin server keeps the last max_log_entries requests in a ring buffer you can filter without touching your log pipeline:
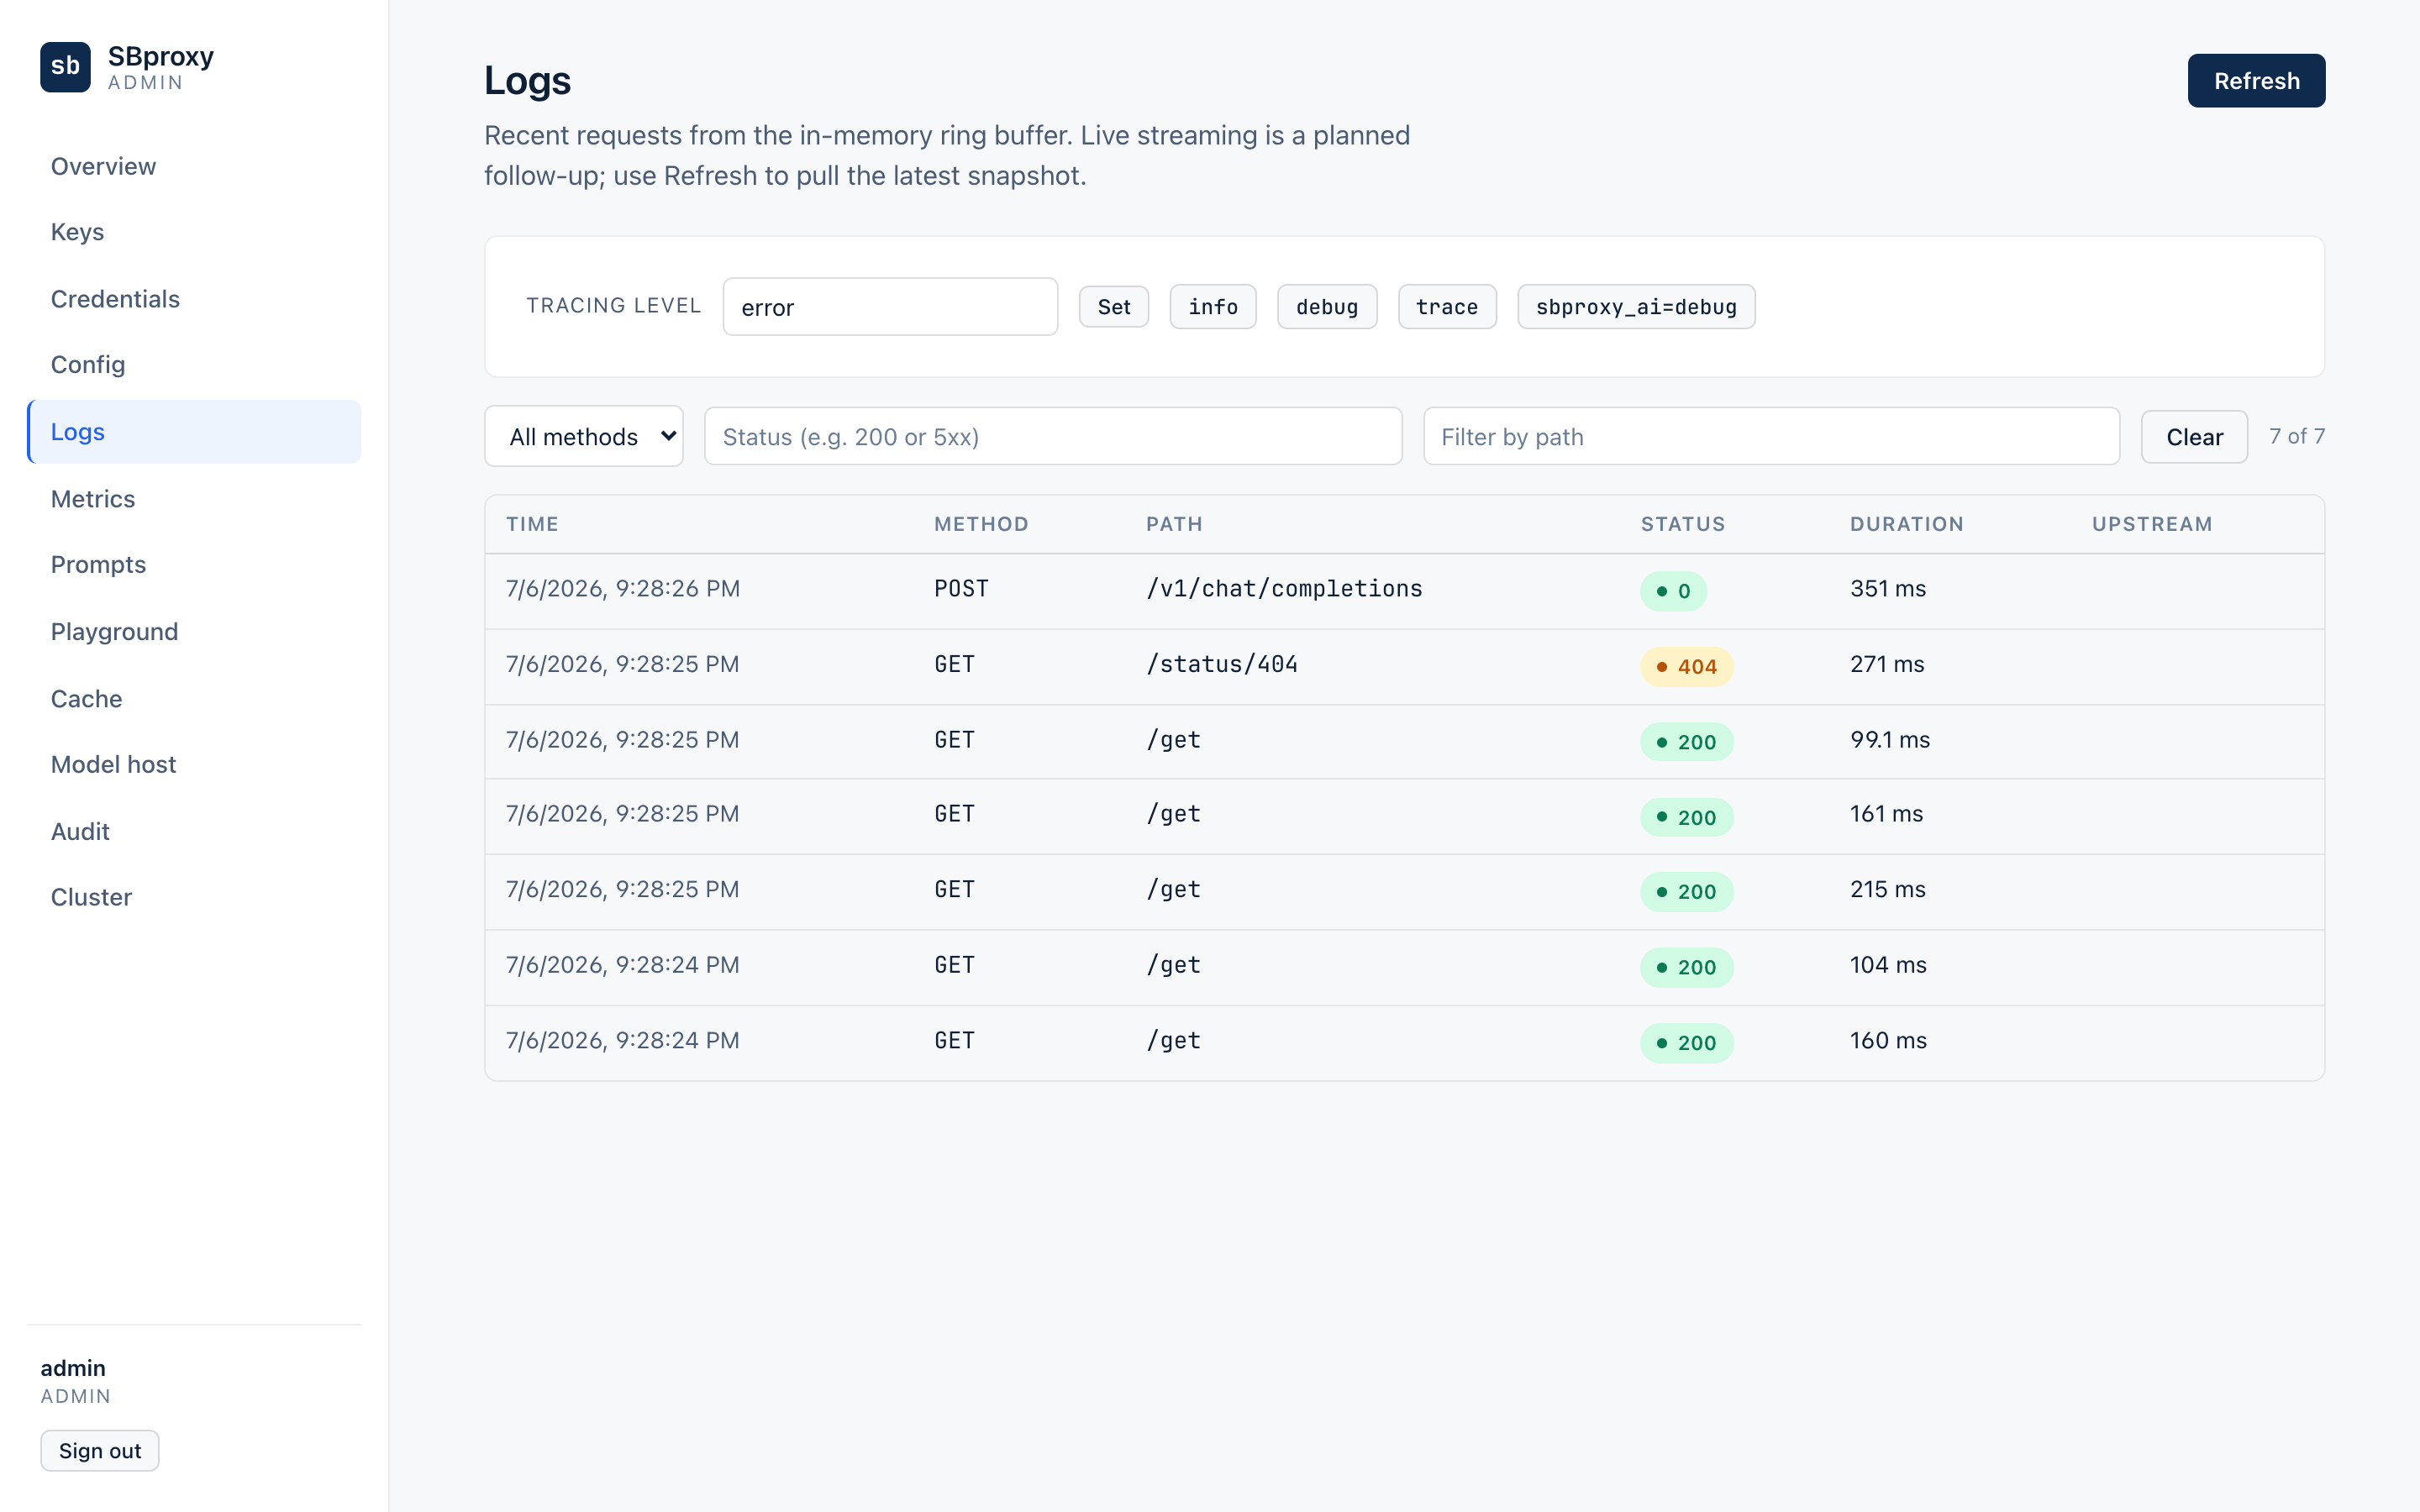
$ curl -s -u admin:change-this 'http://127.0.0.1:9091/api/requests?status=502&limit=5'There is also GET /api/requests/stream, a Server-Sent-Events tail that emits one event per new request, which is the fastest "is it still happening" check available. The admin UI's request log view sits on the same endpoints, with the filters as form controls:
Every state-mutating admin call (reload, key edits, config writes) also emits a typed audit-log envelope on the structured log stream, so the answer to "who reloaded the config at 2:47" is already on disk.
Dashboards and alerts
The repo ships Grafana dashboards and Prometheus rules under dashboards/; the Compose file in the example directory boots Prometheus and Grafana with all of them loaded:
cd examples/use-case-production-ops
docker compose up -d
Grafana is at http://localhost:3000 (admin / admin) with the SBproxy folder pre-provisioned. Nine dashboards ship today. The two you will live in are sbproxy-overview.json (request rate, latency percentiles, error rate, active connections, cache hit ratio, bandwidth) and sbproxy-origins.json (the same story per origin, which is how you tell "everything is down" from "checkout is down"). The rest are feature-area views: sbproxy-security.json for WAF, rate-limit, and auth blocks, sbproxy-ai-gateway.json for provider rates, tokens, TTFT, and fallbacks, sbproxy-ai-value.json for per-tenant and per-credential spend, sbproxy-ai-bot-traffic.json, sbproxy-policy-verdicts.json, sbproxy-judge-backend.json, and sbproxy-model-host.json for GPU serving. dashboards/README.md has the full table.
Prometheus at http://localhost:9090 evaluates the bundled rules from dashboards/prometheus/. The alert file starts with the five you would write yourself anyway:
| Alert | Fires when |
|---|---|
SBProxyHighErrorRate | 5xx rate above 5% for 2 minutes (critical) |
SBProxyHighLatency | p95 latency above 2s for 5 minutes (warning) |
SBProxyAIProviderDown | a provider returns only errors for 2 minutes (critical) |
SBProxyGuardrailSpike | guardrail blocks above 10/min (warning) |
SBProxyHighTokenUsage | over 1M output tokens in an hour (info) |
plus per-tenant and per-credential spend alerts built on the recording rules in recording-rules.yml. You can watch the first one arm itself right now: hammer the dead origin for a couple of minutes (while true; do curl -s -o /dev/null -H 'Host: checkout.local' http://localhost:8080/; sleep 0.2; done) and SBProxyHighErrorRate walks from inactive to pending to firing on the Prometheus alerts page.
Traces, when a log line is not enough
Metrics tell you something is wrong and the access log tells you which requests it hit. When you need to know where inside a request the time went across services, turn on the OTLP exporter:
proxy:
  observability:
    telemetry:
      enabled: true
      endpoint: "http://otel-collector:4317"
      transport: grpc
      sample_rate: 0.1
      always_sample_errors: true
always_sample_errors is the on-call setting: normal traffic is head-sampled at 10%, but 5xx and policy-blocked requests export at 100%, so the trace for the request that paged you exists. The trace_id lands on the matching access-log line, which gives you log-to-trace correlation for free. Monitoring covers propagation, span naming, and the verified backend matrix, and examples/observability-stack/ is a one-command Compose stack with the full pipeline (Tempo, Loki, Phoenix, Langfuse) if you want traces flowing today.
The first incident
Here is how the pieces compose when it is real. An upstream host dies, exactly like checkout.local. The gateway notices before you do: retries fail at connect time, and where you have configured them, active health checks, outlier detection, and the circuit breaker eject the target so new requests stop paying the failure latency (the degradation matrix in degradation.md documents this per dependency; the design rule is that the proxy always starts, keeps serving, degrades visibly in metrics and logs, and recovers on its own). Error rate crosses 5% and holds for two minutes, and SBProxyHighErrorRate pages you.
The operator runbook's triage order works with the surfaces you just wired: confirm /readyz and /health on the affected instance, open sbproxy-overview to decide whether the problem is global or one origin, then let the origins dashboard and a filtered /api/requests?status=502 tell you which upstream it is. Before you restart or roll back anything, capture the config revision, the pod name, and a couple of request ids; you will want them for the review.
If the timeline says the incident started when a config change landed, roll the config back. Hot reload is the mechanism: fix or revert sb.yml, then send SIGHUP or POST /admin/reload. Validation runs first, and a config that fails validation is rejected while the old pipeline keeps serving, so a panicked rollback cannot make things worse; a failed reload shows up in sbproxy_config_reload_total{result="failure"}. Check the change before it goes back out: sbproxy validate sb.yml parses it offline, and sbproxy plan -f sb.yml --against last-good.yml prints the added, changed, and removed origins with a max-blast-radius line (exit 0 means no-op, 2 means changes, 3 means semantic errors), which is worth wiring into CI so the next 3am config diff is smaller than this one. On Kubernetes, helm history sbproxy and helm rollback do the same walk at the deployment layer; the runbook has the exact commands.
You are done when
checkout.localreturnsHTTP/1.1 502 Bad Gatewayandcurl -s localhost:8080/metrics | grep 'status="502"'shows a non-zerosbproxy_requests_totalcounter for it.payments.localreturns200with"status":"degraded"in the body, proving the fallback origin is absorbing the same failure.- The 502 produced a JSON access-log line on stdout with no
upstream_ttfb_msfield. curl -s http://127.0.0.1:9091/readyzreturns 200, and with the Compose stack up, the Grafana SBproxy folder shows the bundled dashboards and the Prometheus alerts page lists thesbproxy_alertsgroup.
Next steps
- Monitoring - the full three-pillar guide: metrics, log sinks and redaction, traces
metrics-stability.md- everysbproxy_*metric with labels and stability tiers- Request Logging - the complete access-log field schema, filters, sampling, and file output
audit-log.md- the append-only envelope behind every admin mutationdegradation.md- what the proxy does while each dependency is downoperator-runbook.md- the dashboard-to-action companion for when a panel is redadmin.md- admin server auth, roles, remote access, and the web UI